Metric Expand
From syxUI — written for both platforms, not translated between them.
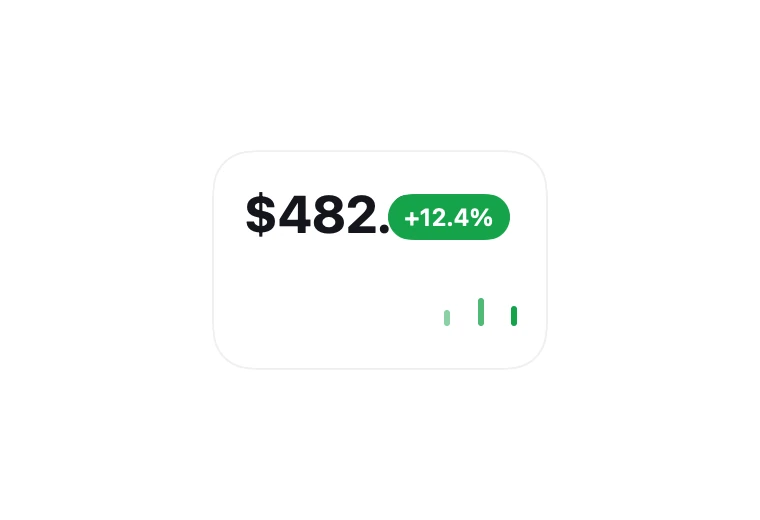
InteractiveA small metric tile that opens into a full sparkline, the tiny bars becoming the first points.
Cards · SwiftUI · Flutter · iOS 17 · Flutter 3.27
- card
- metric
- expand
- sparkline
- chart
- morph
- stat
- dashboard
The actual source
MorphMetricExpand.swift
// Metric Expand · syxUI · https://syxui.dev/components/morph-metric-expand
// Free in any project. Keep this line and credit syxUI where a person can read it.

import SwiftUI

/// A small metric tile that opens into a full sparkline, its tiny preview
/// bars becoming the first points of the line.
///
/// One `p` drives four overlapping motions: the frame grows, the value text
/// scales up, three mini bars morph into the chart's first three points, and
/// the line trims in behind them. Nothing pops in or out — the bars are the
/// same shapes that end up as the chart's dots, just interpolated.
struct MorphMetricExpand: View {
    var accent: Color = Color(red: 0.086, green: 0.639, blue: 0.290)
    var fillColor: Color = Color(red: 0.086, green: 0.639, blue: 0.290)
    var surface: Color = Color(white: 1.0)
    var textColor: Color = Color(red: 0.078, green: 0.086, blue: 0.109)
    var points: Int = 60
    var lineWidth: CGFloat = 2
    /// Preview override. 0 is the closed tile, 1 the open chart.
    var progress: Double? = nil

    @Environment(\.accessibilityReduceMotion) private var reduceMotion
    @State private var interactive: Double = 0

    private var p: Double { progress ?? interactive }

    private let closedSize = CGSize(width: 168, height: 110)
    private let openSize = CGSize(width: 340, height: 230)

    private var growth: Double { ramp(p, 0, 0.55) }
    private var barMorph: Double { ramp(p, 0.35, 0.60) }
    private var lineDraw: Double { ramp(p, 0.45, 1.0) }
    private var fillFade: Double { ramp(p, 0.70, 1.0) }

    private var size: CGSize {
        CGSize(
            width: lerp(closedSize.width, openSize.width, growth),
            height: lerp(closedSize.height, openSize.height, growth)
        )
    }

    private var chartInsetTop: CGFloat { lerp(0, 80, growth) }
    private var chartInsetBottom: CGFloat { lerp(0, 26, growth) }
    private let chartInsetSides: CGFloat = 16

    /// A deterministic, gently rising series — enough to read as "real" data
    /// without needing a network call for a component demo.
    private var series: [Double] {
        let n = max(points, 4)
        let raw = (0..<n).map { i -> Double in
            let x = Double(i) / Double(n - 1)
            return 0.5 + sin(x * .pi * 2.4) * 0.28 + sin(x * .pi * 5.1 + 1.3) * 0.12 + x * 0.14
        }
        let lo = raw.min() ?? 0
        let hi = raw.max() ?? 1
        let span = max(hi - lo, 0.0001)
        return raw.map { 0.08 + 0.84 * (($0 - lo) / span) }
    }

    private func allPoints(in size: CGSize) -> [CGPoint] {
        let values = series
        let n = values.count
        let usableWidth = size.width - chartInsetSides * 2
        let usableHeight = size.height - chartInsetTop - chartInsetBottom
        return values.enumerated().map { index, value in
            CGPoint(
                x: chartInsetSides + usableWidth * CGFloat(index) / CGFloat(max(n - 1, 1)),
                y: chartInsetTop + usableHeight * CGFloat(1 - value)
            )
        }
    }

    private func linePath(from pts: [CGPoint]) -> Path {
        Path { path in
            guard var previous = pts.first else { return }
            path.move(to: previous)
            for point in pts.dropFirst() {
                let mid = CGPoint(x: (previous.x + point.x) / 2, y: (previous.y + point.y) / 2)
                path.addQuadCurve(to: mid, control: previous)
                previous = point
            }
            if let last = pts.last { path.addLine(to: last) }
        }
    }

    private func areaPath(from pts: [CGPoint], baseline: CGFloat) -> Path {
        var path = linePath(from: pts)
        guard let first = pts.first, let last = pts.last else { return path }
        path.addLine(to: CGPoint(x: last.x, y: baseline))
        path.addLine(to: CGPoint(x: first.x, y: baseline))
        path.closeSubpath()
        return path
    }

    private let barHeights: [CGFloat] = [8, 14, 10]
    private let barAnchorX: [CGFloat] = [0.70, 0.80, 0.90]
    private let barAnchorYBottom: CGFloat = 0.80

    var body: some View {
        let s = size
        let pts = allPoints(in: s)
        let shape = RoundedRectangle(cornerRadius: 20, style: .continuous)

        return ZStack(alignment: .topLeading) {
            shape.fill(surface)
            shape.strokeBorder(Color.black.opacity(0.06))

            areaPath(from: pts, baseline: s.height - chartInsetBottom)
                .fill(
                    LinearGradient(
                        colors: [fillColor.opacity(0.28 * fillFade), fillColor.opacity(0)],
                        startPoint: .top,
                        endPoint: .bottom
                    )
                )

            linePath(from: pts)
                .trim(from: 0, to: lineDraw)
                .stroke(accent, style: StrokeStyle(lineWidth: lineWidth, lineCap: .round, lineJoin: .round))

            ForEach(0..<3, id: \.self) { index in bar(index, target: pts[safe: index] ?? .zero, in: s) }

            axisLabels(in: s).opacity(fillFade)

            Text(displayValue)
                .font(.system(size: 40, weight: .bold))
                .foregroundStyle(textColor)
                .scaleEffect(lerp(26.0 / 40.0, 1.0, growth), anchor: .topLeading)
                .offset(x: lerp(16, 20, growth), y: lerp(16, 18, growth))

            chip.offset(chipOffset(in: s))
        }
        .frame(width: s.width, height: s.height)
        .clipShape(shape)
        .contentShape(shape)
        .onTapGesture(perform: toggle)
        .sensoryFeedback(.impact(flexibility: .soft), trigger: interactive > 0.5)
        .accessibilityElement()
        .accessibilityAddTraits(.isButton)
        .accessibilityLabel("Revenue, \(displayValue), up 12.4 percent")
        .accessibilityValue(p > 0.5 ? "Chart expanded" : "Chart collapsed")
    }

    private let displayValue = "$482.90"

    private func bar(_ index: Int, target: CGPoint, in size: CGSize) -> some View {
        let closed = CGPoint(
            x: barAnchorX[index] * size.width,
            y: barAnchorYBottom * size.height - barHeights[index] / 2
        )
        let x = lerp(closed.x, target.x, barMorph)
        let y = lerp(closed.y, target.y, barMorph)
        let width: CGFloat = lerp(3, 2, barMorph)
        let height: CGFloat = lerp(barHeights[index], 2, barMorph)

        return Capsule(style: .continuous)
            .fill(accent.opacity(lerp(0.5, 1.0, Double(index) / 2)))
            .frame(width: width, height: height)
            .position(x: x, y: y)
            .accessibilityHidden(true)
    }

    private var chip: some View {
        Text("+12.4%")
            .font(.system(size: 12, weight: .semibold))
            .foregroundStyle(.white)
            .padding(.horizontal, 8)
            .padding(.vertical, 4)
            .background(accent, in: Capsule())
            .accessibilityHidden(true)
    }

    private func chipOffset(in size: CGSize) -> CGSize {
        let closed = CGSize(width: 88, height: 22)
        let open = CGSize(width: size.width - 82, height: 16)
        return CGSize(width: lerp(closed.width, open.width, growth), height: lerp(closed.height, open.height, growth))
    }

    private func axisLabels(in size: CGSize) -> some View {
        HStack {
            Text("30d ago")
            Spacer()
            Text("Today")
        }
        .font(.system(size: 10))
        .foregroundStyle(textColor.opacity(0.45))
        .padding(.horizontal, chartInsetSides)
        .frame(width: size.width, alignment: .leading)
        .offset(y: size.height - 18)
        .accessibilityHidden(true)
    }

    private func toggle() {
        guard progress == nil else { return }
        let next: Double = interactive > 0.5 ? 0 : 1
        withAnimation(reduceMotion ? .linear(duration: 0) : .spring(response: 0.42, dampingFraction: 0.85)) {
            interactive = next
        }
    }
}

private extension Array {
    subscript(safe index: Int) -> Element? {
        indices.contains(index) ? self[index] : nil
    }
}

private func clamp(_ value: Double) -> Double { min(max(value, 0), 1) }

private func ramp(_ value: Double, _ from: Double, _ to: Double) -> Double {
    clamp((value - from) / (to - from))
}

private func lerp(_ a: CGFloat, _ b: CGFloat, _ t: Double) -> CGFloat {
    a + (b - a) * CGFloat(t)
}

private func lerp(_ a: Double, _ b: Double, _ t: Double) -> Double {
    a + (b - a) * t
}

#Preview {
    VStack(spacing: 40) {
        MorphMetricExpand()
        MorphMetricExpand(progress: 1.0)
    }
    .padding(40)
}
iOS 17 · No dependencies
SwiftUI note. The three preview bars are the same Capsule shapes that end up as the chart's first three points — their rect lerps toward pointPosition(i:), it never gets swapped for a different view. `trim(from:to:)` on the sparkline Path is what makes the line draw itself.
Dependencies
- SwiftUI
- No external dependencies
- Flutter
- No external dependencies
Requires iOS 17
Requires Flutter 3.27