Spark Line
From syxUI — written for both platforms, not translated between them.
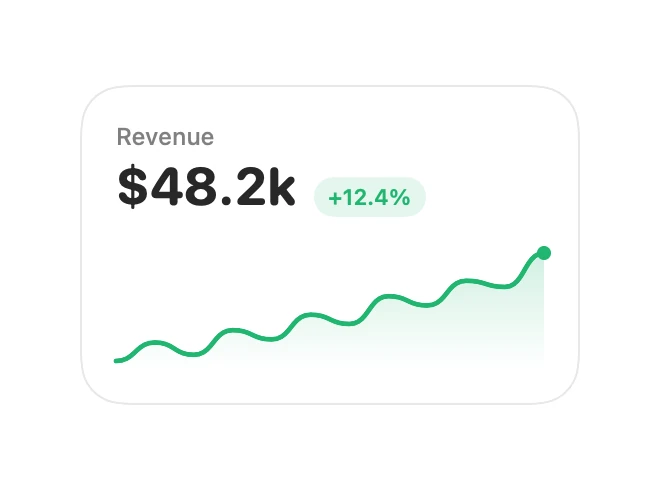
A trend card with a smoothed sparkline, gradient fill, and delta pill.
Charts · SwiftUI · Flutter · iOS 17 · Flutter 3.27
- chart
- sparkline
- trend
- stats
- graph
- dashboard
- finance
The actual source
SparkLine.swift
// Spark Line · syxUI · https://syxui.dev/components/spark-line
// Free in any project. Keep this line and credit syxUI where a person can read it.

import SwiftUI

/// A compact trend card: sparkline, gradient fill, and a delta pill.
///
/// The path is built once from the values with a Catmull-style smoothing, so
/// the curve stays readable at small sizes without a charting framework.
struct SparkLine: View {
    var title: String = "Revenue"
    var value: String = "$48.2k"
    var delta: String = "+12.4%"
    var isPositive: Bool = true
    var values: [Double] = [12, 18, 14, 22, 19, 27, 24, 33, 30, 38, 36, 47]
    var accent: Color = Color(red: 0.13, green: 0.71, blue: 0.44)

    var body: some View {
        VStack(alignment: .leading, spacing: 0) {
            Text(title)
                .font(.system(size: 12, weight: .medium))
                .foregroundStyle(.secondary)

            HStack(alignment: .firstTextBaseline, spacing: 8) {
                Text(value)
                    .font(.system(size: 26, weight: .bold, design: .rounded))
                    .monospacedDigit()

                Text(delta)
                    .font(.system(size: 11, weight: .semibold))
                    .foregroundStyle(accent)
                    .padding(.horizontal, 7)
                    .padding(.vertical, 3)
                    .background(accent.opacity(0.12), in: Capsule())
            }
            .padding(.top, 2)

            chart
                .frame(height: 62)
                .padding(.top, 14)
        }
        .padding(18)
        .frame(width: 250)
        .background(.white, in: RoundedRectangle(cornerRadius: 22, style: .continuous))
        .overlay {
            RoundedRectangle(cornerRadius: 22, style: .continuous)
                .strokeBorder(Color(white: 0.91), lineWidth: 1)
        }
        .accessibilityElement(children: .combine)
        .accessibilityLabel("\(title) \(value), \(delta)")
    }

    private var chart: some View {
        GeometryReader { geo in
            let points = normalised(in: geo.size)

            ZStack {
                // Fill first so the stroke sits cleanly on top of it.
                area(points, height: geo.size.height)
                    .fill(
                        LinearGradient(
                            colors: [accent.opacity(0.22), accent.opacity(0)],
                            startPoint: .top,
                            endPoint: .bottom
                        )
                    )

                line(points)
                    .stroke(accent, style: StrokeStyle(lineWidth: 2.4,
                                                       lineCap: .round,
                                                       lineJoin: .round))

                if let last = points.last {
                    Circle()
                        .fill(accent)
                        .frame(width: 7, height: 7)
                        .position(last)
                }
            }
        }
    }

    /// Map values into the drawing rect, flipping y so larger reads as higher.
    private func normalised(in size: CGSize) -> [CGPoint] {
        guard values.count > 1 else { return [] }
        let lowest = values.min() ?? 0
        let highest = values.max() ?? 1
        let span = max(highest - lowest, 0.0001)
        let step = size.width / CGFloat(values.count - 1)
        let inset: CGFloat = 4

        return values.enumerated().map { index, value in
            let ratio = (value - lowest) / span
            return CGPoint(
                x: CGFloat(index) * step,
                y: inset + (1 - ratio) * (size.height - inset * 2)
            )
        }
    }

    private func line(_ points: [CGPoint]) -> Path {
        Path { path in
            guard let first = points.first else { return }
            path.move(to: first)
            for (index, point) in points.enumerated().dropFirst() {
                let previous = points[index - 1]
                let midX = (previous.x + point.x) / 2
                path.addCurve(
                    to: point,
                    control1: CGPoint(x: midX, y: previous.y),
                    control2: CGPoint(x: midX, y: point.y)
                )
            }
        }
    }

    private func area(_ points: [CGPoint], height: CGFloat) -> Path {
        var path = line(points)
        guard let first = points.first, let last = points.last else { return path }
        path.addLine(to: CGPoint(x: last.x, y: height))
        path.addLine(to: CGPoint(x: first.x, y: height))
        path.closeSubpath()
        return path
    }
}

#Preview {
    SparkLine()
        .padding(30)
}
iOS 17 · No dependencies
SwiftUI note. No Swift Charts dependency. Curves are cubic segments with midpoint controls, which stays smooth without overshooting between points.
Dependencies
- SwiftUI
- No external dependencies
- Flutter
- No external dependencies
Requires iOS 17
Requires Flutter 3.27